
Titanic - Learning from Disaster
What happened?
The widely considered “unsinkable” RMS Titanic sank after colliding with an iceberg.
Unfortunately, there weren't enough lifeboats for everyone onboard, resulting in the death of 1502 out of 2224
passengers and crew.
While there was some element of luck involved in surviving,
it seems some groups of people were more likely to survive than others.
...
Now we want to know: what sorts of people were more likely to survive?
Our goal is to predict the survival rate (classification: death or alive).
In order to achieve this, we will:
- Cleanup our data
- Scale it
- Apply the random forest algorithm
Understanding the data
This dataset contains the information of all passengers
- Select the columns that will be relevant for our goal: [Survived, Pclass, Sex, Age]
- Find out which data types are contained within our dataset: [String, numeric, NaN]
- Replace missing values in rows
Preparing the data
A quick way to visualize correlation between features is by using a Heatmap
We split our data into two sets: train set and test set (80% / 20%)
Let's take a look at the histograms of Survived and Pclass...
... and get the counts of male/female
We still have to normalize our data!
- Some Age data is missing. Fill it with help of sklearn's SimpleImputer (strategy: Age's mean)
- Convert non-numeric data into numeric with sklearn's OneHotEncoder.
(strategy: map Embarked to ["C", "S", "Q", "N"] and Sex to [Male, Female]) - Once transformed, get rid of old/unnecessary columns: [Embarked, Name, Ticket, Cabin, Sex]
Modelling
We apply the Random Forest Algorithm
For this we separated our datasets into training set and testing set earlier.
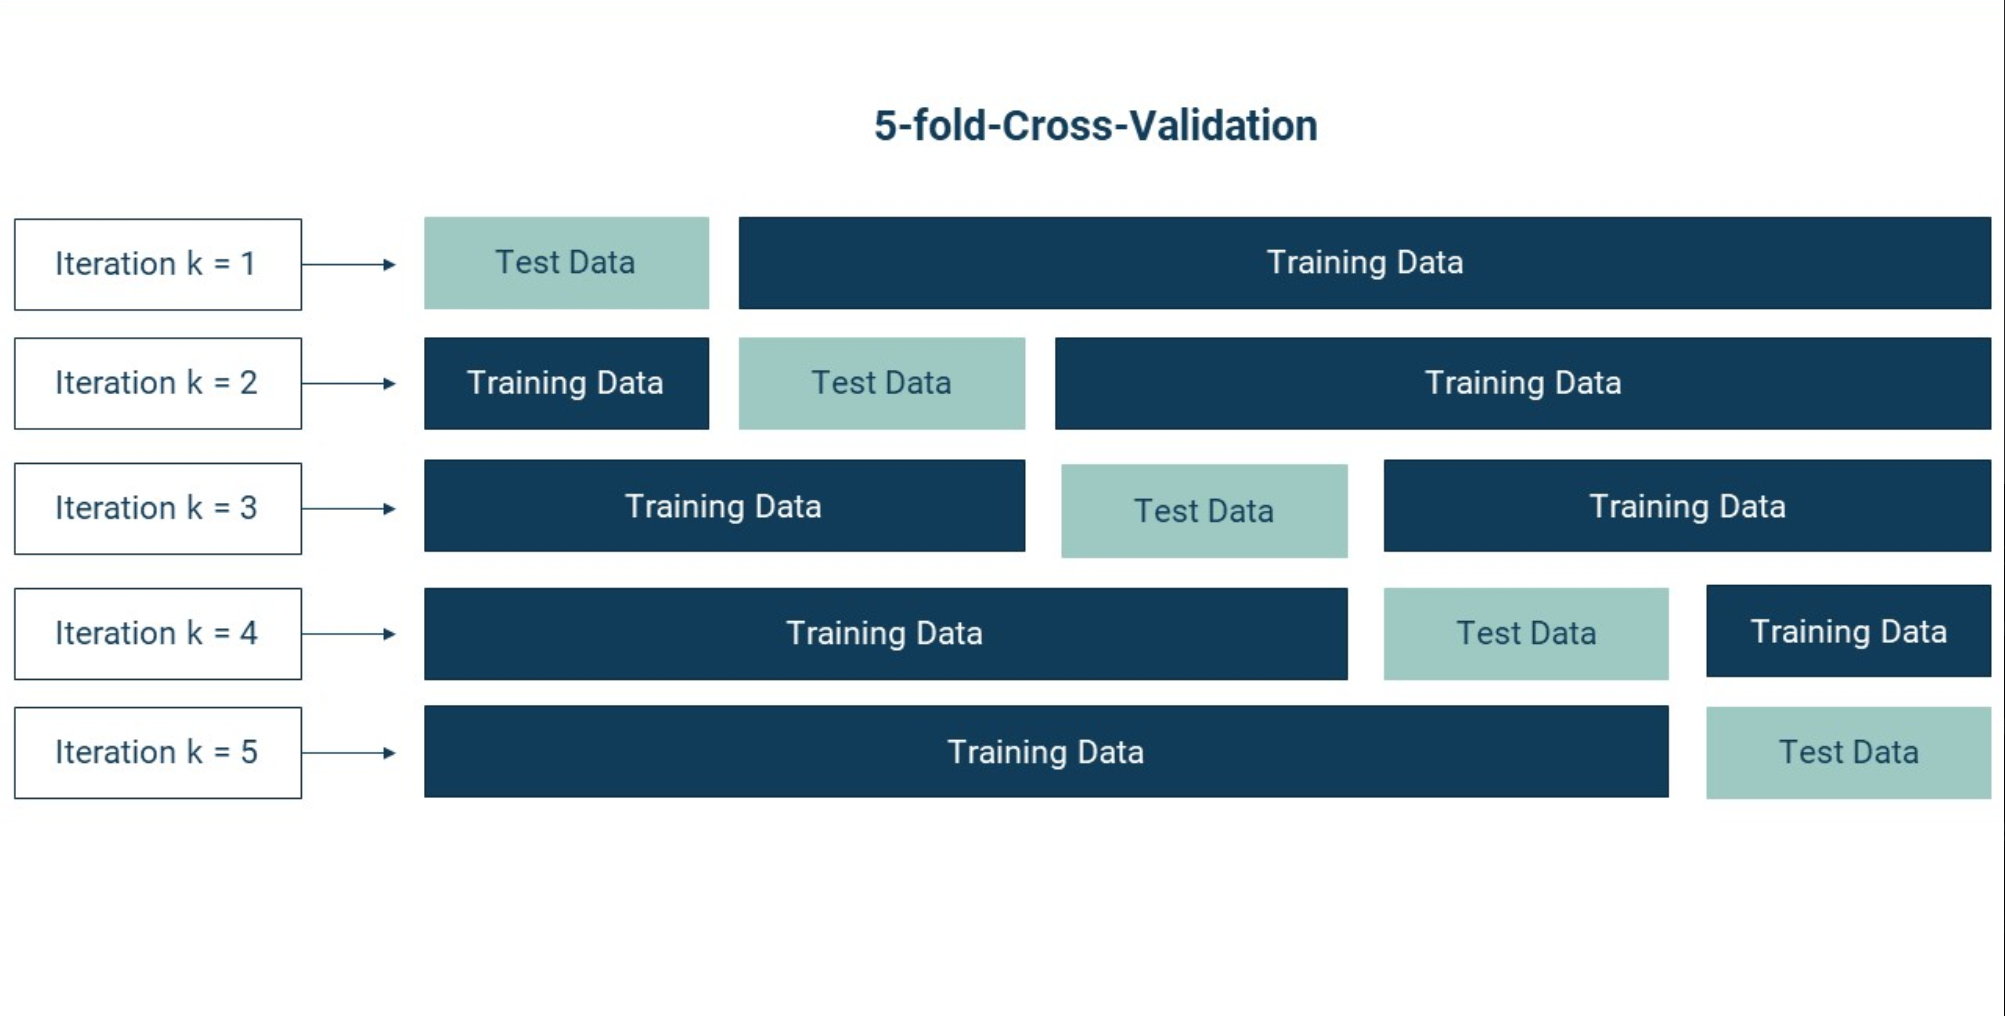
If we want to apply cross-validation, we also need to create a validation set
Evaluation
Let's review our process
- RandomForestClassifier() will be run approx. 40 times
- The best parameters provide us a result with 0.8379888268156425 accuracy
- We apply the algorithm in both our test set and validation set
- Voila! Our predictions should now look like this:
Assessment: We are ready to move to deployment.
Deployment
This website is our deployment. We hope you enjoyed it :)
seffs